Introduction
Welcome to SpectraMania, an advanced iOS application engineered for real-time audio spectrum analysis. This guide will help you install, configure, and efficiently use the app to visualize and analyze sound signals.
The development of SpectraMania focused primarily on achieving high performance and leveraging the latest capabilities of modern iPhone hardware and software.
Key Features:
Top-performance, high-resolution real-time spectrum analysis of audio signals
Precise 3D spectrum measurement in pause mode, with the ability to target specific points in the spectrum
Audio playback from a movable cursor position in pause mode
Saving of the recorded audio as a standard WAV file, with the option to select a specific portion of the signal
Fully configurable spectrum analysis parameters
Spectrum display supports both Portrait and Landscape orientations
Interactive adjustment of Spectrum, Waveform, and Equalizer view areas via touch gestures
Real-time calculation and display of peak frequency
System Requirements
Minimum Requirements: iOS 15.0+, iPhone 8 or newer, iPad 7 or newer Recommended: iOS 17.0+, iPhone 13 or newer.
Installation and Setup
Open the App Store on your iPhone or iPad.
Search for 'SpectraMania'.
Tap Download → Install.
Upon first launch, grant Microphone Access.
Getting Started
Launch the app.
Adjust required parameters on “Spectrum Analysis Parameters” screen (optional).
Tap “GO!” button to begin live spectrum capture.
Speak, play music, or connect an external input.
Observe real-time spectrum, waveform and equalizer graphs in real time together with frequency of spectrum amplitude maximum in the right bottom area.
Tap the screen while in Spectrum Analysis mode to adjust how the display area is divided among the following visual components:
Spectrum – upper left area
Waveform – lower left area
Equalizer – upper right area
Current frequency of maximum spectrum amplitude – lower right area

Turning of your device will trigger either “Portrait” or “Landscape” mode of spectrum visualization.
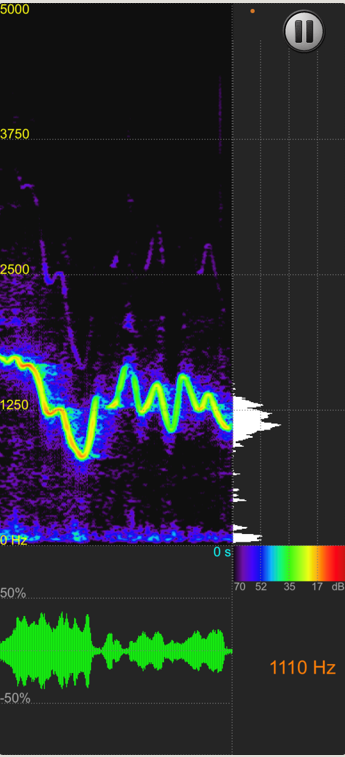
Portrait mode:
Landscape mode:

Tip: use Portrait mode for better frequency resolution and Landscape mode if you want to visualize longer audio signals.
Spectrum Analysis Settings
After start of the application “Spectrum Analysis Settings” screen will be displayed:
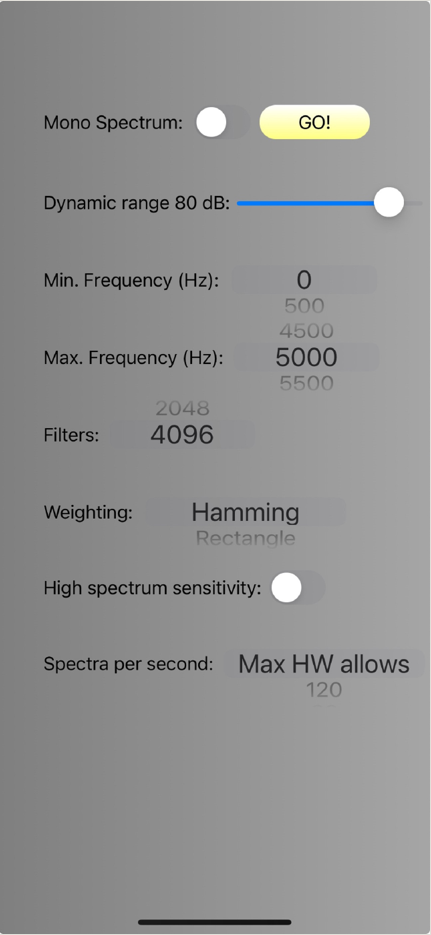
Parameters of spectrum analysis can be easily configured:
Spectrum visualization: Mono or color
Dynamics range: 10 dB- 90 dB
Minimum displayed frequency: 0 - 24 kHz with step 1 kHz
Maximum displayed frequency: 1 - 24 kHz with step 1 kHz
FFT Filters:
- 32
- 64
- 128
- 256
- 512
- 1024
- 2048
- 4096Window functions:
- Hamming
- Rectangle
- Triangle
- Hann
- BlackmanHigh-sensitivity spectrum mode: Normalizes each spectrum so that its peak value equals 0 dB (toggle On/Off).
Spectra per second: (result may depend on hardware)
- Maximum allowed by hardware
- 120
- 60
- 40
- 30
- 24
- 20
By definition, in spectrum analysis, the Maximum Frequency cannot exceed half of the Sample Rate (Sample Rate ÷ 2).
For the standard iPhone sample rate of 48,000 Hz, the maximum possible frequency is therefore 24,000 Hz.
The minimum frequency value must always be less than the maximum frequency.
The application retains your current parameter settings between sessions.
You can return to the “Spectrum Analysis Settings” screen at any time by performing a swipe-right gesture.
Real-time Spectrum Analysis Mode
The SpectraMania application supports two operational modes:
Online Spectrum Analysis and Visualization Mode – the default mode active when the application starts.
Spectrum Measurement Mode – activated when you tap the Pause button during analysis.
Application screen during spectrum analysis:

During real-time spectrum analysis, the frequency of the maximum amplitude of the current spectrum is automatically displayed in the lower right area of the screen.
Spectrum Measurement Mode
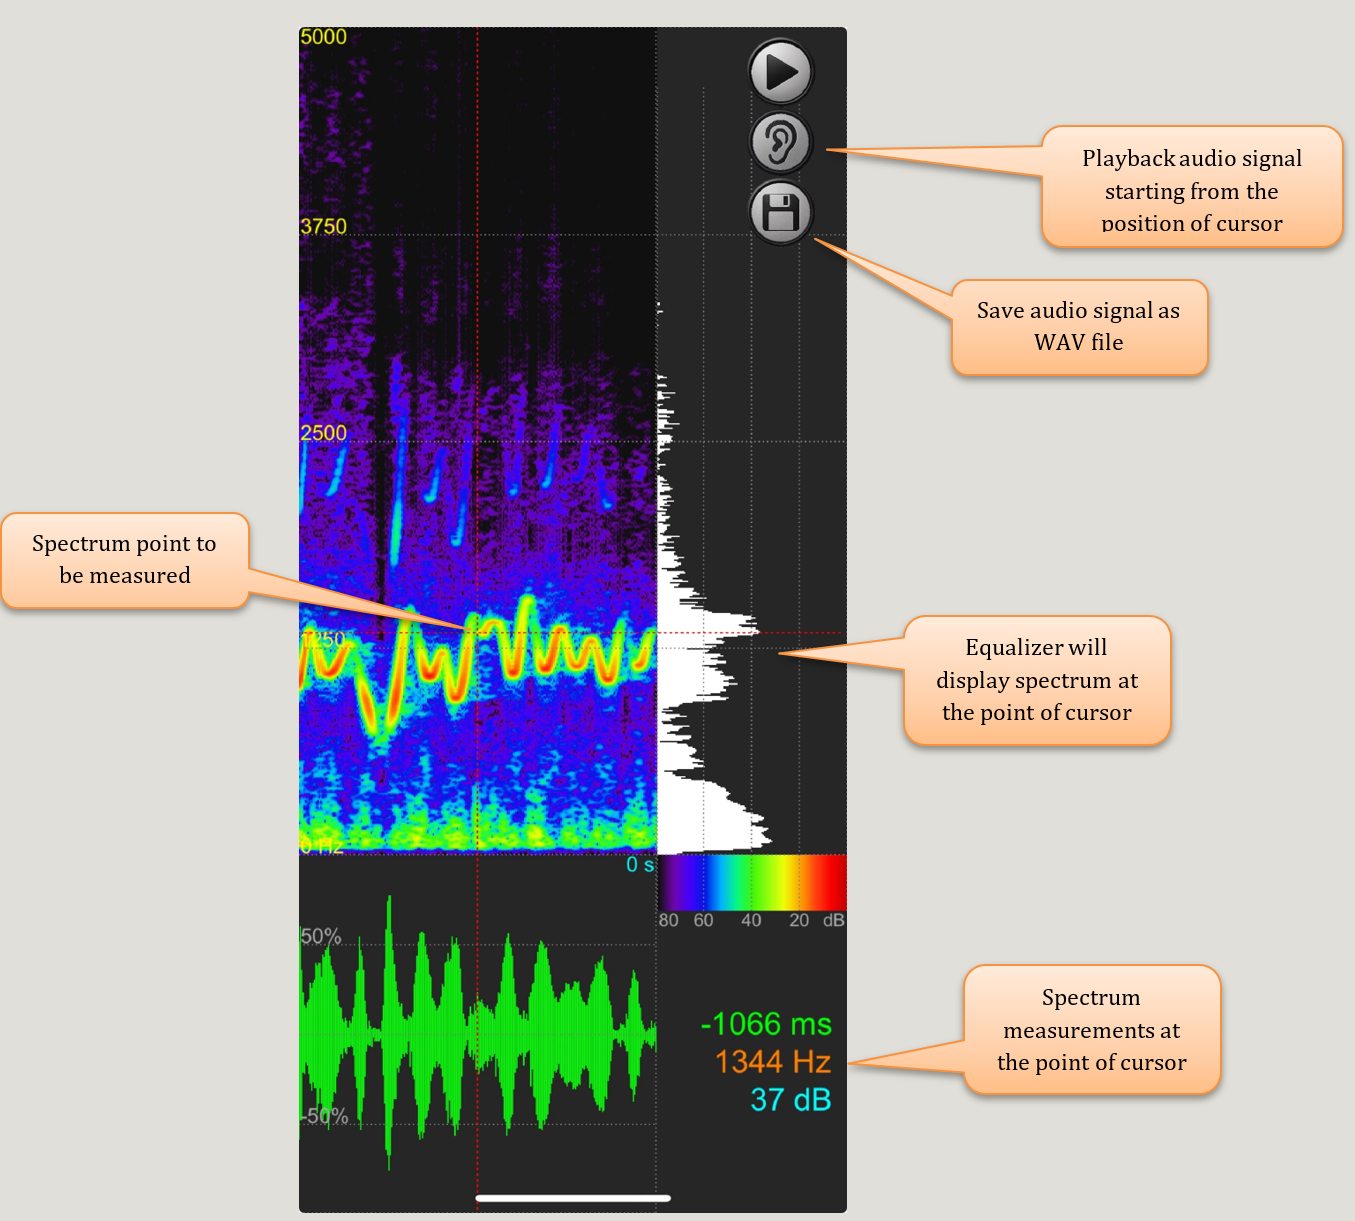
When the Pause button is pressed during Spectrum Analysis Mode, the application switches to Spectrum Measurement Mode, which allows precise measurement of the spectra displayed in the upper left area of the screen.
A movable cursor (red dotted lines) appears on the screen. You can reposition it by tapping or dragging the cursor to specific spectrum points for accurate measurement.
Tip: A stylus can be used to simplify precise cursor positioning on the screen.
Measurements corresponding to the position of the movable cursor are displayed in the lower-right area of the screen in the following format:
Time (ms): Time elapsed since the spectrum recording was stopped
Frequency (Hz): Frequency value in Hertz
Amplitude (dB): Amplitude value in decibels
To ensure accurate time measurements at specific spectrum points, timestamps are used. This means that even if the spectrum visualization speed changes (for example, due to background applications), the time values remain precise.
Playback
At any time while in Spectrum Measurement Mode, you can play back a portion of the audio signal starting from the position of the movable cursor and continuing to the end of the recording by tapping the ear icon button.
During playback, the equalizer in the upper-right area of the screen dynamically visualizes the spectrum corresponding to the current playback position.
Saving to WAV File
The SpectraMania application supports saving the audio signal as a standard WAV (Waveform Audio File Format) file, which can be used for further signal analysis in other applications.
The generated WAV file has the following predefined properties:
- Sample Rate: 48,000 Hz
- Bit Depth (Sample Size): 16-bit
- Number of Channels: 1 (Mono)
- Compression Type (Audio Format): 1 = PCM (Linear Pulse Code Modulation)
The Save feature is available only in Spectrum Measurement Mode, not in Spectrum Analysis Mode.
Tap the diskette icon to open the Save dialog.
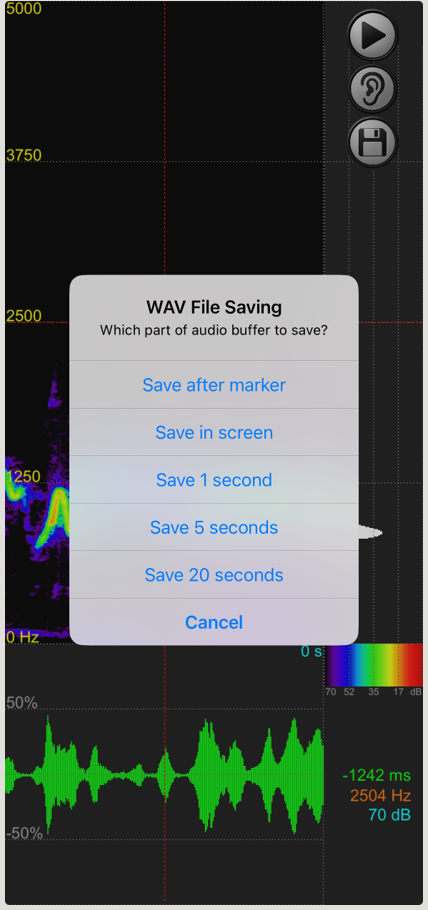
The following options are available to specify which portion of the audio signal to save:
- Save After Marker: Saves the signal from the current position of the movable cursor to the end of the recorded signal.
- Save In Screen: Saves only the portion of the signal currently displayed on the screen.
- Save 1 Second: Saves the last 1 second of the recording.
- Save 5 Seconds: Saves the last 5 seconds of the recording.
- Save 20 Seconds: Saves the last 20 seconds of the recording.
The resulting WAV file is saved to your iPhone’s local storage.
Ensure that sufficient storage space is available before saving.
The WAV file name is automatically generated in the following format:
YY-MM-DD_HH.MM.SS — based on the exact time the file is saved, where:
- YY – current year
- MM – current month (01–12)
- DD – current day of the month (01–31)
- HH – current hour in 24-hour format (00–23)
- SS – current second (00–59)
Tip: It is recommended to play back the audio signal by tapping the Playback button before saving it using the Save After Cursor option.
Support and Contact Information
For help, contact support@spectra-mania.com or visit www.spectra-mania.com/contact .